YO43 Property Price Guide and Insights
Discover YO43's 2026 property market: average prices for flats vs. houses, bedroom-count breakdowns, % of homes with gardens or balconies, plus an interactive postcode heatmap.

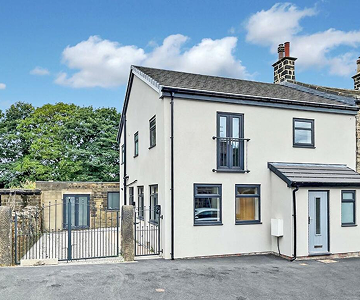
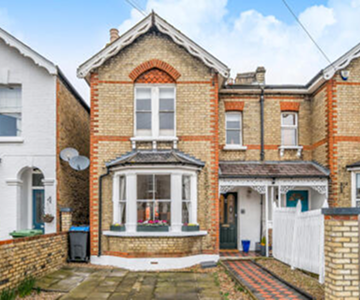
Houses
Explore our blog for market insights, guides and a sprinkling of our favourite properties!
What is the average price of a house in YO43?
The average price for a house in YO43 is £306k, costing on average £279 per sqft.
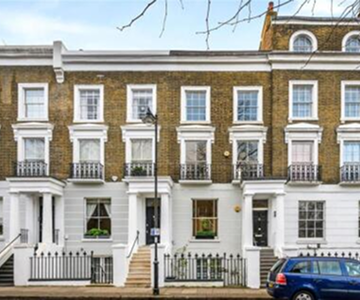
Average prices of houses by bedroom count are: £218k for a two-bedroom, £260k for a three-bedroom, £373k for a four-bedroom, and £540k for a five-bedroom.
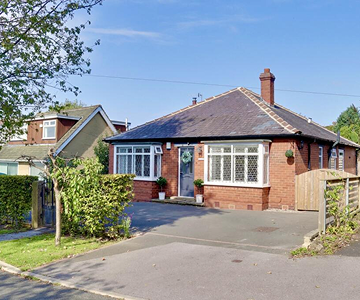
What share of houses in YO43 feature gardens and parking?
In YO43, 93% of houses have a garden and 95% include parking.
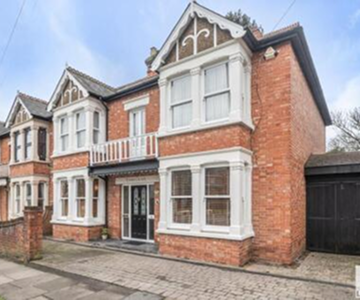
What is the breakdown of property types in YO43?
The housing mix in YO43 is 41% detached, 35% semi-detached, 9% terraced, and 15% other.
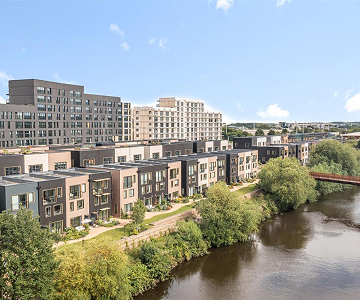
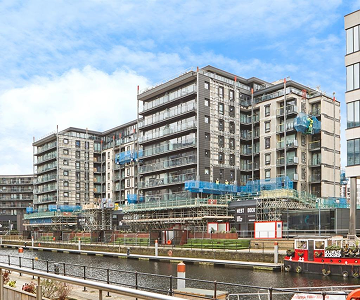
Flats and apartments
Explore our blog for market insights, guides and a sprinkling of our favourite properties!
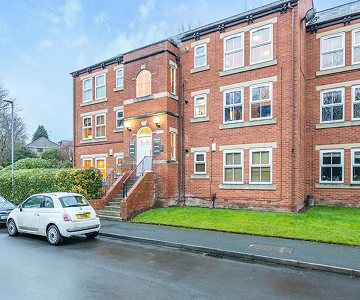
What is the average price of a flat in YO43?
The average price for a flat in YO43 is £114k, costing on average £225 per sqft.
Average prices of flats by bedroom count are: £86k for a one-bedroom, £129k for a two-bedroom, N/A for a three-bedroom, and N/A for a four-bedroom.
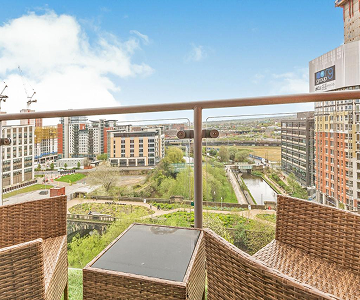
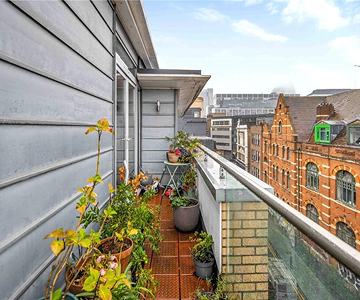
What share of flats in YO43 feature balconies and parking?
In YO43, 27% of flats have a balcony and 100% include parking.
What is the breakdown of lease types in YO43?
The leasing mix in YO43 is 82% leasehold and 18% freehold.
Looking for a property in YO43?
Searching for your next home doesn't have to be endless evenings and hundreds of tabs. When a property you want comes on the market, we'll let you know.