Bulwell, Nottingham Rent Guide and Insights
Discover Bulwell, Nottingham's 2026 rental market: average rents for flats vs. houses, bedroom-count breakdowns, % of homes with gardens or balconies, plus an interactive postcode heatmap.

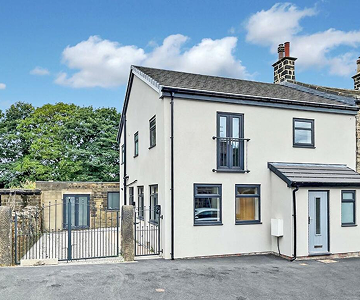
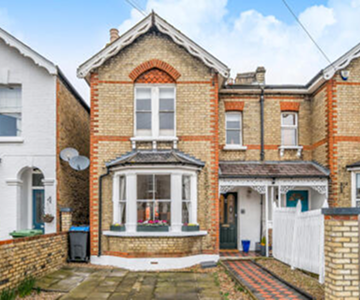
Houses
Explore rental insights, market trends, and average rents for houses in the area!
What is the average rent for a house in Bulwell, Nottingham?
The average monthly rent for a house in Bulwell, Nottingham is £1,203, costing on average £1 per sqft.
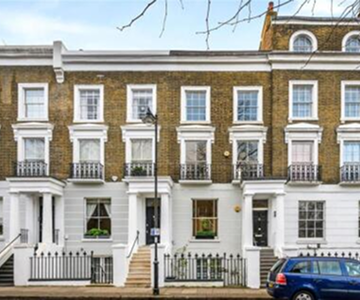
Average rents for houses by bedroom count are: £925 for a two-bedroom, £1,112 for a three-bedroom, £1,550 for a four-bedroom, and £2,727 for a five-bedroom.
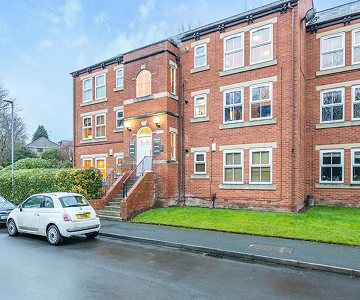
What share of houses in Bulwell, Nottingham feature gardens and parking?
In Bulwell, Nottingham, 85% of houses have a garden and 80% include parking.
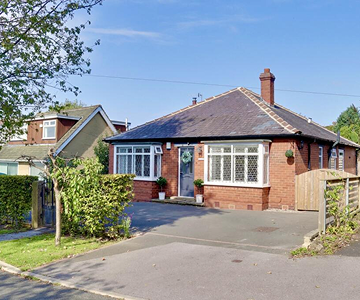
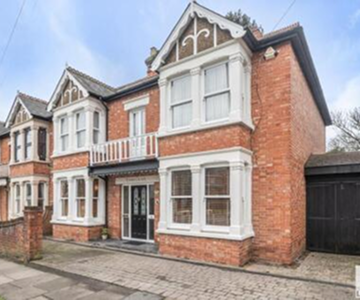
What is the breakdown of property types in Bulwell, Nottingham?
The housing mix in Bulwell, Nottingham is 12% detached, 50% semi-detached, 35% terraced, and 5% other.
What is the most expensive area in Bulwell, Nottingham to rent a home?
The most expensive area to rent a house in Bulwell, Nottingham is NG8, where the average monthly rent is £1,421.
What is the cheapest area in Bulwell, Nottingham to rent a home?
The cheapest area to rent a house in Bulwell, Nottingham is NG6, where the average monthly rent is £985.
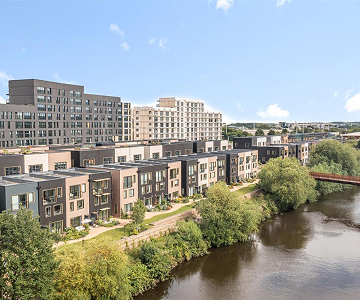
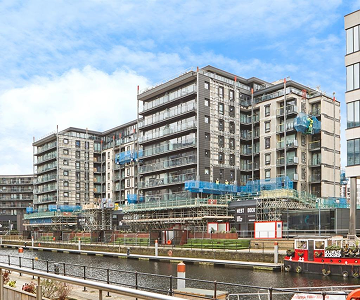
Flats and apartments
Explore rental insights, market trends, and average rents for flats in the area!
What is the average rent for a flat in Bulwell, Nottingham?
The average monthly rent for a flat in Bulwell, Nottingham is £850, costing on average £2 per sqft per month.
Average rents for flats by bedroom count are: £768 for a one-bedroom, £839 for a two-bedroom, £786 for a three-bedroom, and N/A for a four-bedroom.
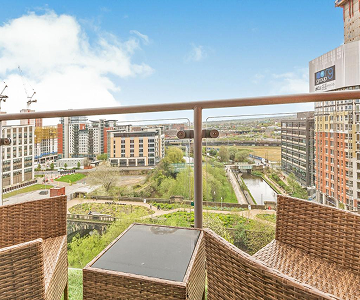
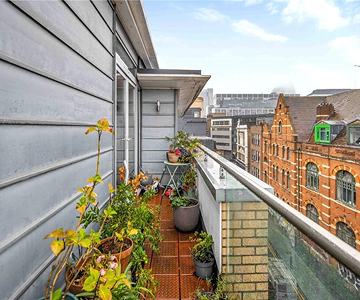
What share of flats in Bulwell, Nottingham feature balconies and parking?
In Bulwell, Nottingham, 4% of flats have a balcony and 61% include parking.
What is the most expensive area in Bulwell, Nottingham to rent a flat?
The most expensive area to rent a flat in Bulwell, Nottingham is NG8, where the average monthly rent is £905.
What is the cheapest area in Bulwell, Nottingham to rent a flat?
The cheapest area to rent a flat in Bulwell, Nottingham is NG6, where the average monthly rent is £795.
Looking to rent in Bulwell, Nottingham?
Searching for your next home doesn't have to be endless evenings and hundreds of tabs. When a property you want comes on the market, we'll let you know.