Chart Sutton Rent Guide and Insights
Discover Chart Sutton's 2026 rental market: average rents for flats vs. houses, bedroom-count breakdowns, % of homes with gardens or balconies, plus an interactive postcode heatmap.

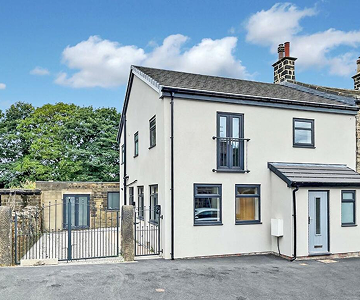
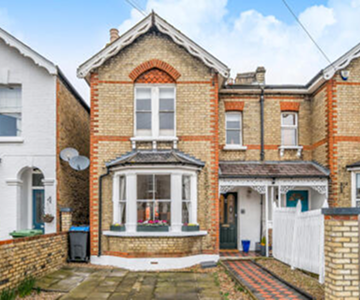
Houses
Explore rental insights, market trends, and average rents for houses in the area!
What is the average rent for a house in Chart Sutton?
The average monthly rent for a house in Chart Sutton is £1,899, costing on average £4 per sqft.
Average rents for houses by bedroom count are: £1,390 for a two-bedroom, £1,665 for a three-bedroom, £2,183 for a four-bedroom, and £3,250 for a five-bedroom.
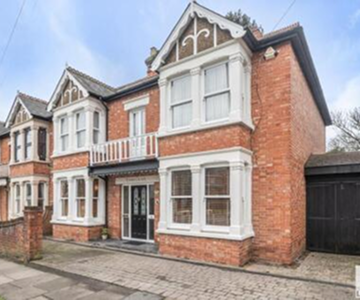
What share of houses in Chart Sutton feature gardens and parking?
In Chart Sutton, 92% of houses have a garden and 90% include parking.
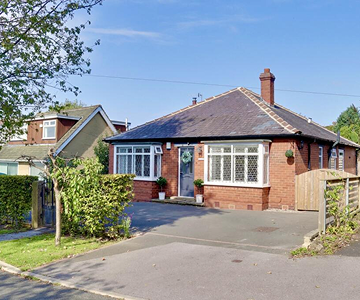
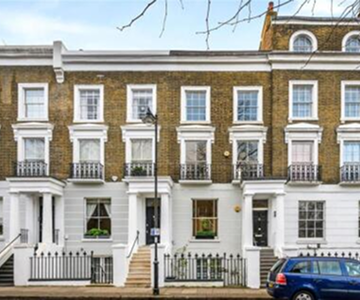
What is the breakdown of property types in Chart Sutton?
The housing mix in Chart Sutton is 31% detached, 31% semi-detached, 31% terraced, and 8% other.
What is the most expensive area in Chart Sutton to rent a home?
The most expensive area to rent a house in Chart Sutton is ME17, where the average monthly rent is £1,899.
What is the cheapest area in Chart Sutton to rent a home?
The cheapest area to rent a house in Chart Sutton is ME17, where the average monthly rent is £1,899.
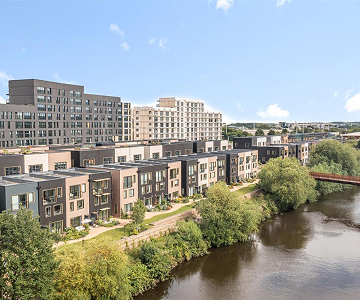
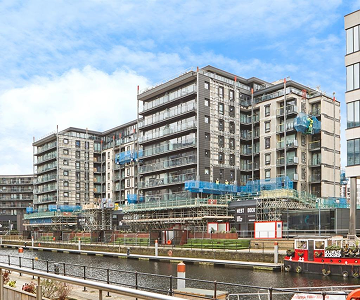
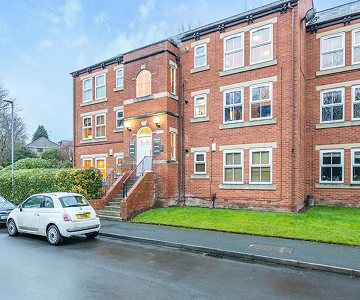
Flats and apartments
Explore rental insights, market trends, and average rents for flats in the area!
What is the average rent for a flat in Chart Sutton?
The average monthly rent for a flat in Chart Sutton is £1,099, costing on average N/A per sqft per month.
Average rents for flats by bedroom count are: £1,019 for a one-bedroom, £1,129 for a two-bedroom, £1,300 for a three-bedroom, and N/A for a four-bedroom.
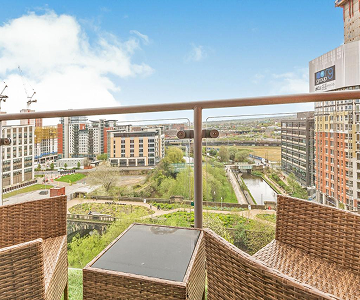
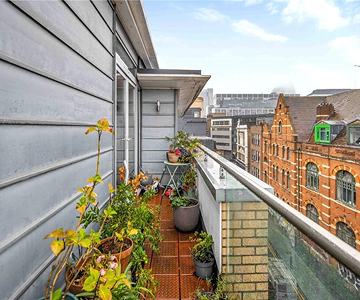
What share of flats in Chart Sutton feature balconies and parking?
In Chart Sutton, 0% of flats have a balcony and 89% include parking.
What is the most expensive area in Chart Sutton to rent a flat?
The most expensive area to rent a flat in Chart Sutton is ME17, where the average monthly rent is £1,099.
What is the cheapest area in Chart Sutton to rent a flat?
The cheapest area to rent a flat in Chart Sutton is ME17, where the average monthly rent is £1,099.
Looking to rent in Chart Sutton?
Searching for your next home doesn't have to be endless evenings and hundreds of tabs. When a property you want comes on the market, we'll let you know.
Nearby
Explore our rent guides for different nearby postcodes. Each guide provides insights into the local rental market, average rents, and trends to help you make informed decisions.